
By Dian Maliszewski
This paper was part of the proceedings of the Canadian School Libraries TMC8 Research Symposium, held in Toronto on January 31 and February 1, 2025. The paper may be also accessed on the CSL Research Archive website.
Personal Context
My name is Diana Maliszewski and I am a teacher-librarian. I wrote this paper during the 2024-2025 school year, which marked my 28th year of permanent contract teaching with the Toronto District School Board, started in 1997, and my 20th year at the same school – Agnes Macphail Public School, started in 2004. For the past twenty years, with the exception of one, the “pandemic year”, I have created an annual report to share with my administrators demonstrating how the school library makes a difference to the students, staff, and community members it serves. I also curate a scrapbook for every year I’ve taught, annotating and illustrating what occurs over the course of each school year. This paper is meant to examine the impact of this kind of data collection.
Professional Context
Foundations for School Library Learning Commons in Canada: A Framework for Success
Foundations for School Library Learning Commons in Canada: A Framework for Success was published in 2023 (Canadian School Libraries, 2023). It emerged from discussions held at the seventh Treasure Mountain Canada think tank and research symposium in 2022 (Canadian School Libraries, 2022). As stated in the preface, Foundations was “designed to support the successful implementation of Leading Learning: Standards of Practice for School Library Learning Commons in Canada” (Canadian School Libraries 2020, p. 3). Shaped by the International Federation of Library Association’s School Library Guidelines, 2nd revised edition, (Schultz-Jones & Oberg, eds., 2015), Foundations states that three critical foundations must exist for effective school libraries to emerge and prosper: “strong policy, robust funding, and equity of access” (Canadian School Libraries, 2023, p. 7). When these three cornerstones exist, they adequately support eight essential frameworks identified by Canadian School Libraries:
- Physical and Virtual LLC Spaces
- Technological Infrastructures
- Human Resources
- Accessibility
- Ethical Standards
- LLC Management
- A Culture of Growth
- Accountability
The focus of this paper will be on the eighth framework: accountability.
Accountability
Foundations for School Library Learning Commons in Canada: A Framework for Success asserts that it is extremely difficult to “set a consistent evaluation rubric for school administrators to assess program efficacy”, however, it is still important to assess library programs “according to established criteria as expressed in national and international guidelines” (Canadian School Libraries, 2023, p. 18).
The way we have evaluated school libraries has evolved over the years, “shifting from output measures and arbitrary benchmarks to assessing outcomes and impacts, and setting a framework for growth and continuous improvement” (Canadian School Libraries, 2023, p. 18).). This can be challenging, because it is easier to collect quantitative statistics related to collections and circulation. Foundations for School Library Learning Commons in Canada: A Framework for Success (Canadian School Libraries, 2023), advises us that accountability assessments “will not be about the number of resources or technology tools available to students but how those resources and technologies enable learning and knowledge building” (Canadian School Libraries, 2023, p. 18).
Examining the impact of the school library learning commons, and sharing these observations are of utmost importance. As Foundations for School Library Learning Commons in Canada: A Framework for Success (Canadian School Libraries, 2023) states, “Measuring and communicating outcomes and impacts provide insight into the success of programs and initiatives. Understanding outcomes and impacts inform practice and deepen professional knowledge.” (Canadian School Libraries, 2023, p. 19).
Foundations for School Library Learning Commons in Canada: A Framework for Success (Canadian School Libraries, 2023) offers a three-prong cycle of accountability, which includes annual plans, budgets, and annual reports. The annual report “should incorporate both qualitative and quantitative data, focusing on outcomes and impacts as they relate to the strategic plan” (Canadian School Libraries, 2023, p. 19).
When Personal Precedes Professional
I started creating these annual reports long before Foundations for School Library Learning Commons in Canada: A Framework for Success (Canadian School Libraries, 2023) and even Leading Learning: Standards of Practice for School Library Learning Commons in Canada (Canadian School Libraries, 2020) existed. However, I was exposed to the concept of evidence-based practice so my initial categories in my annual reports could be classified as more like output measurements, but with glimpses of outcomes and impact sprinkled in. I used a template created by another, unnamed teacher-librarian in my school board.
My annual report from 2004-2005 stated my three goals for what I called back then the “Agnes Macphail Public School Library Information Centre”. (Appendix A) Categories included the number of collaborative units taught, collection development, circulation, budget, and professional development. In this annual report, I even listed the potential goals for the following year. I stopped listing goals in my 2012-2013 annual report. This blog post of mine from 2012 alludes to reasons why I stopped including goals in my annual reports:
“Carol [Koechlin] has recommended using the “Big Think” (Loertscher et al, 2009), during my collaborative units to deepen understanding and gather evidence of learning as it happens instead of trying to recollect at the end of the year; Christy [Veltma, colleague] … suggested using an infographic or visual … instead of statistics to demonstrate the impact of the school library program. Both are great pieces of advice – but part of what makes the process endurable is that the product will be appreciated. I know I should do it for me, because I cannot guarantee the response by my administration or senior board staff. I guess I need to tackle it when I’m in the mood to impress myself – because I like looking at my school year scrapbooks or things I’ve written and marveled at how I was able to do so much” (Maliszewski, 2012).
It is unfortunate that I ceased including planning goals, because they actually match the “Accountability Cycle” as outlined in Foundations for School Library Learning Commons in Canada: A Framework for Success (Canadian School Libraries, 2023). It took me until 2018-2019, but nearly five years after I received the advice from Christy Veltman to create an infographic, I finally started to include one as part of my report.
Around this point in time, the organization People for Education undertook an initiative called “Measuring What Matters”. Their goal was to “build consensus and alignment around broader goals and indicators of success for public education” (People for Education, 2013). They recognized that some competencies, such as citizenship, creativity, health, social-emotional learning, and quality learning environments, were not easily quantifiable. “Assessment of these competencies is complex, and we cannot rely on the tools and strategies typically used to assess other skills or knowledge” (People for Education, 2013).
Similar to the “Measuring What Matters” research (People for Education, 2013), and before Foundations for School Library Learning Commons in Canada: A Framework for Success (Canadian School Libraries, 2023), was published, I knew that there were some flaws in my annual reports. I realized that this annual report didn’t always convey the full picture of the impact of my school library learning commons. I will outline the challenges associated with each data set in the sections devoted to each below.
I consulted with several people who had recommendations (Maliszewski, 2019):
- Jordan Graham [Professional Library, Toronto District School Board] suggested using positive quotes from people, listing take-aways from conferences, and including a section called “stories with impact”.
- Lisa Wallace [Teacher] contained her annual report to three pages with a focus on looking ahead and some other categories I hadn’t considered, such as kinds of books most borrowed.
- Beth Lyons [Peel District School Board, ON, teacher-librarian] embedded quotes that highlighted her pedagogical philosophy and analyzed the types of collaborative lessons most often requested by teachers.
- Jonelle St-Aubyn [Peel District School Board, ON, teacher-librarian] used a narrative approach with Book Creator featuring her Bitmoji liberally used, for a very entertaining read.
Data Patterns
Longitudinal data can be rather difficult to collect. Since I have been at the same school for twenty years, it is exciting to see patterns and trends over time.
Collaborative Units
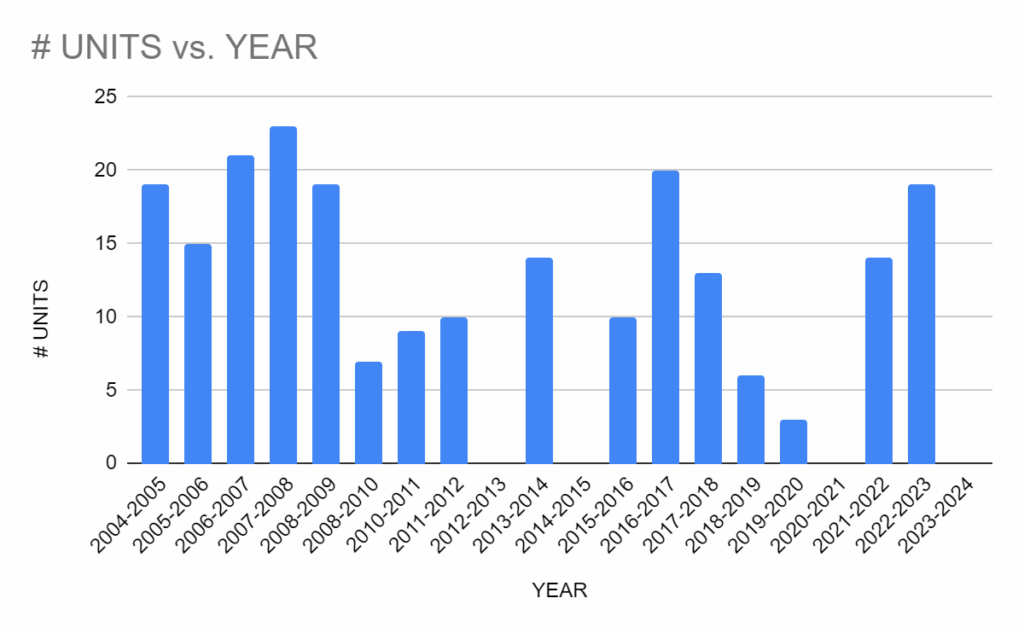
I record the number of collaborative units that involve me and the school library. These numbers are an interesting barometer of how school library scheduling trends can fluctuate even within the same school. As the above graph shows, there were four years where no collaborative teaching time occurred. In 2012-13, it was due to no collaborative allocation times; I only provided prep coverage (media, library, ICT and dance/drama). In 2014-15, the “score” was zero because I was covering prep subjects, just like in 2012-13. In 2020-21, the reason for the lack of partnerships was that all Toronto District School Board elementary school libraries were closed and I transitioned to being a classroom teacher that year. Last year, in 2023-24, all of my collaborative teaching time disappeared because the school was not allocated enough ESL teaching time for the number of students that needed servicing. The last ten years have had more dramatic peaks and valleys than the first ten years of my tenure at this school when it comes to the number of collaborative units taught in conjunction with a classroom teacher.
The number of collaborative teaching units taught do not necessarily give an accurate view of the impact. What if there were fewer collaborative partnerships, but these partnerships were deeper or more meaningful? I have attempted to capture these outcome / impact measures without much success. I include a section in our collaborative planning documents that asked the educators to note how the impact would be realized, but this has never been effective at collecting data. Often, it is those “unexpected comments” that “come from left field” that reveal the impact of a collaboratively taught unit. For instance, this year, I partnered with the Grade 6 teacher to “spice up” the Social Studies lessons (Maliszewski, 2024). We used Gather, an online meeting tool used by virtual office workers and one of the students seemed particularly adept. When I asked how he felt so comfortable in the environment, he explained that we had done Gather together when he was in Grade 3 (in 2021-22). The funny thing was that I would have considered the Grade 3 social studies collaboration a “failure” because there were so many technical difficulties that we couldn’t achieve what we set out to do (Maliszewski 2022b). Yet, this student not only had fond memories of the experience, he was able to transfer his learning years later.
So, how do we document the impact of these “deeper” collaborations? Sometimes, we may not see the fruits of our labor until much later. In the meantime, the photographic evidence helps supplement the numbers. I find that I am more likely to take photos of collaborative lessons that I am particularly excited about and that have “more things going on”. My emotions or feelings may not be an accurate measurement of the outcome, but it might help. Maybe including “exit tickets” to students may be of benefit. Thanks to feedback from Ontario teacher-librarians Melanie Mulcaster and Kate Johnson-McGregor, I have designed a general exit ticket as a Google Form to use with any class I see, to collect these “stories with impact”. (Appendix B)
Library Recess Visits
I only began recording library recess visits in a format that lent itself to accurate reporting in the 2016-2017 school year. Previous attempts, using a student paper sign-in binder, made it too labor-intensive to extract and examine the data. After creating a Google Form, data collection became easier.
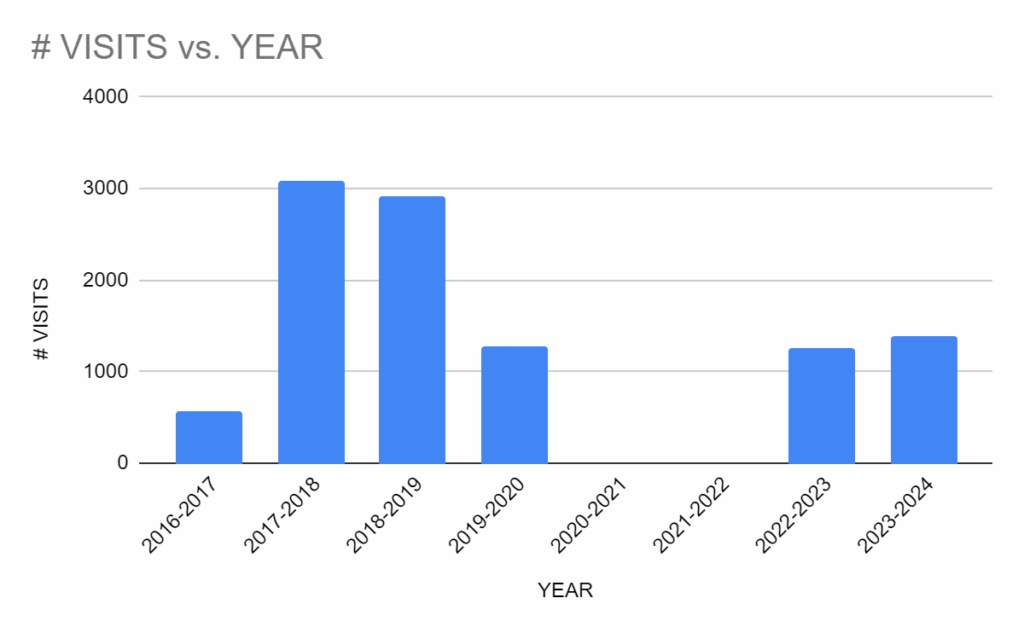
The large gap is directly a result of the COVID-19 pandemic. Students were not allowed to congregate in groups beyond their class cohorts, so visiting the library was forbidden. For two of these years, recess visits only lasted (or were recorded) for 5 months, so looking at an average per month gives a slightly different perspective.
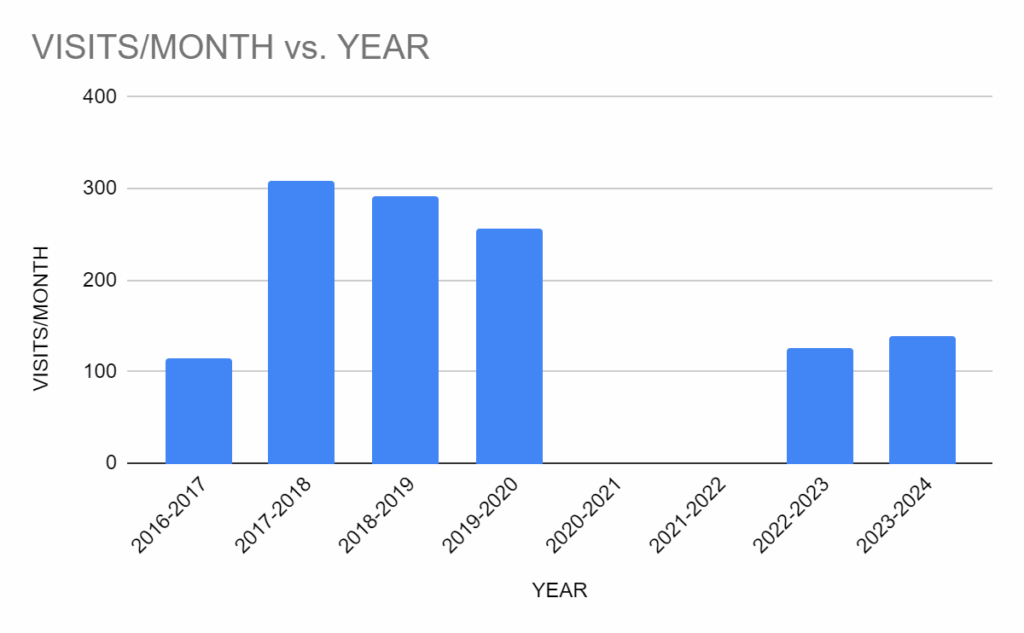
I also record the reasons for the recess visits. The priorities have shifted with the times. Last year, the top 3 reasons were to play, finish work, and conduct a Forest of Reading chat (Ontario Library Association, 2024) In 2018-2019, the top 3 reasons were to use the makerspace, play, finish work and read. Play seems to have taken on greater significance. This is good for student mental health, but how do you convey this in a report? Once again, sharing photos of students joyfully interacting with each other is important to supplementing these statistics.
Forest of Reading Statistics
I examined my school’s Forest of Reading (Ontario Library Association, 2024) data in a previous Treasure Mountain Canada paper, “Rebuilding After the COVID Fire Hit the Forest of Reading” (Maliszewski, 2022c). I began to track the number of chats I conducted with students in 2019. Once again, the numbers only tell part of the story.
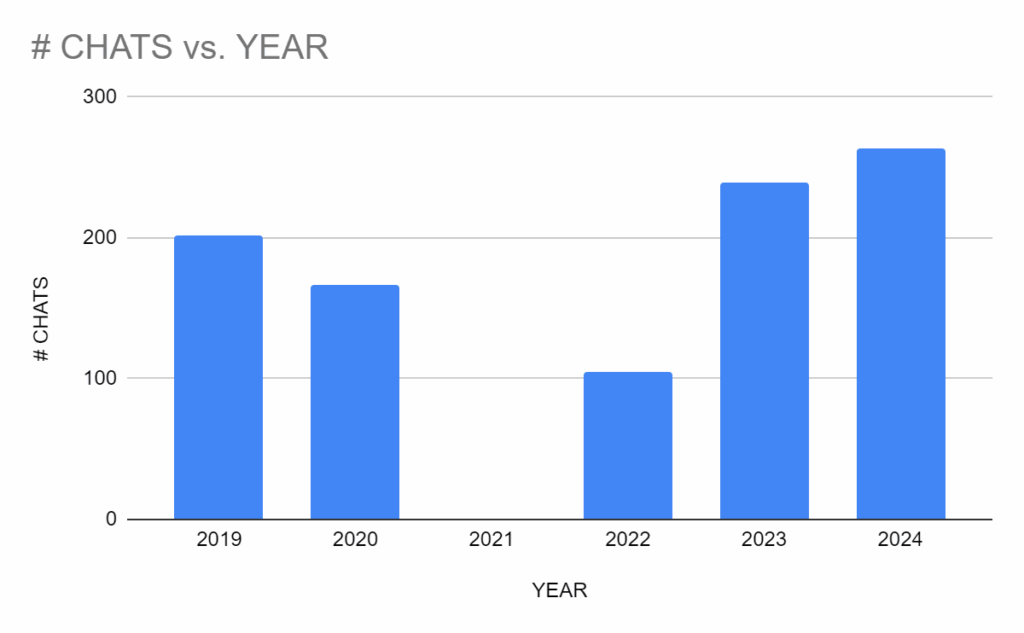
The gap, once again, is attributed to the pandemic. During the 2020-2021 school year, I was a classroom teacher and was unable to run the Forest of Reading program at all. Since then, there has been a steady incline in the number of chats I have participated in with students about the Forest of Reading nominees. Is it actually possible to continue to rise? Will there not come a time where it’s just technically impossible to fit any more time slots to chat with students? How do we capture the impact of some of these chats? How do I include the student who had to re-do conversations but gradually became more adept at having informal conversations about reading? I know I’ve photographed proud students flashing their completed Forest of Reading passports. Noticing those small but meaningful chances in a student’s attitude are hard to bottle and hard to draw a direct line to school library influence. I guess I would include Jayden, a Grade 5 student who, during the first week of school, asked me when we would begin our Forest of Reading chats again.
Budget Allocation
In the Toronto District School Board, the budget allocation is based on the number of students enrolled in the school. It works out to $14.25 per elementary school student, (Toronto District School Board, n.d.). In 2004-2005, the amount I was granted greatly exceeded the required amount. This is partly why my principal at the time, Wayne Hamilton, was awarded the 2005 OSLA Administrator of the Year Award (Ontario School Library Association, 2024).
In 2011-12, I decided to start tracking how much of my budget I spent. Interpreting these numbers can go either way. If I spent more than my allocated budget, does that indicate that my budget was insufficient for the demand, or that I struggled to keep within my means?
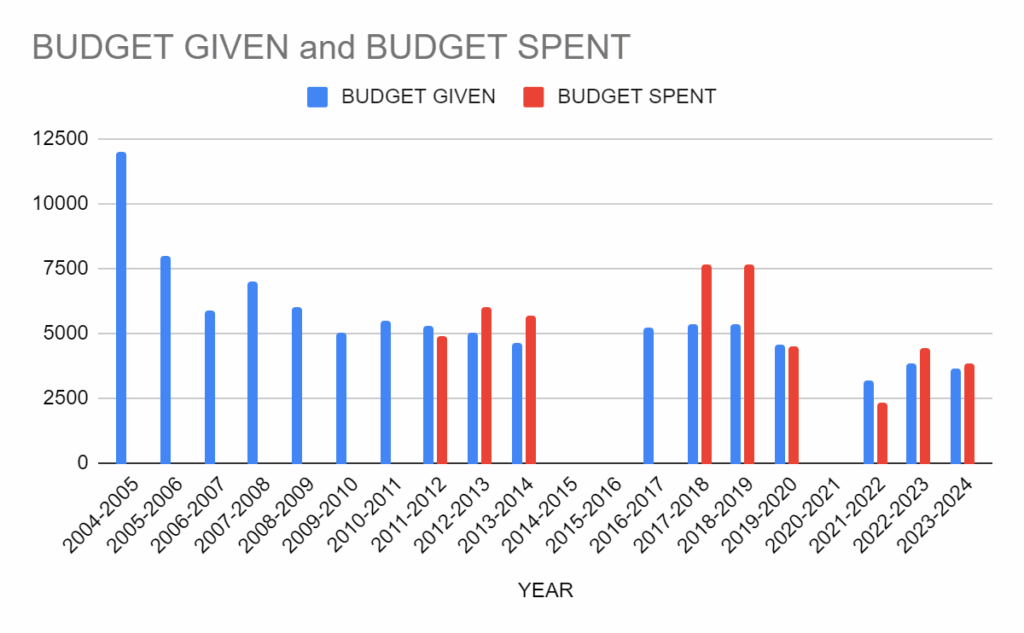
This double bar graph clearly demonstrates a disturbing pattern – a regular decline in the budget allocation for my school. This can be linked to the declining enrolment – according to the statistics shown on the board website, we have 307 students (Toronto District School Board, n.d.). However, as Foundations for School Library Learning Commons in Canada: A Framework for Success clearly shows, “consistent funding that supports the online, cyclical development of wide-ranging, vibrant collections is required for a sustainable and relevant library learning commons” (Canadian School Libraries, 2023 p. 7). This does not take into account the rising costs of purchasing books. Prices have increased (Readers First, 2024). It costs more to buy fewer books, so it is harder to stretch the budget.
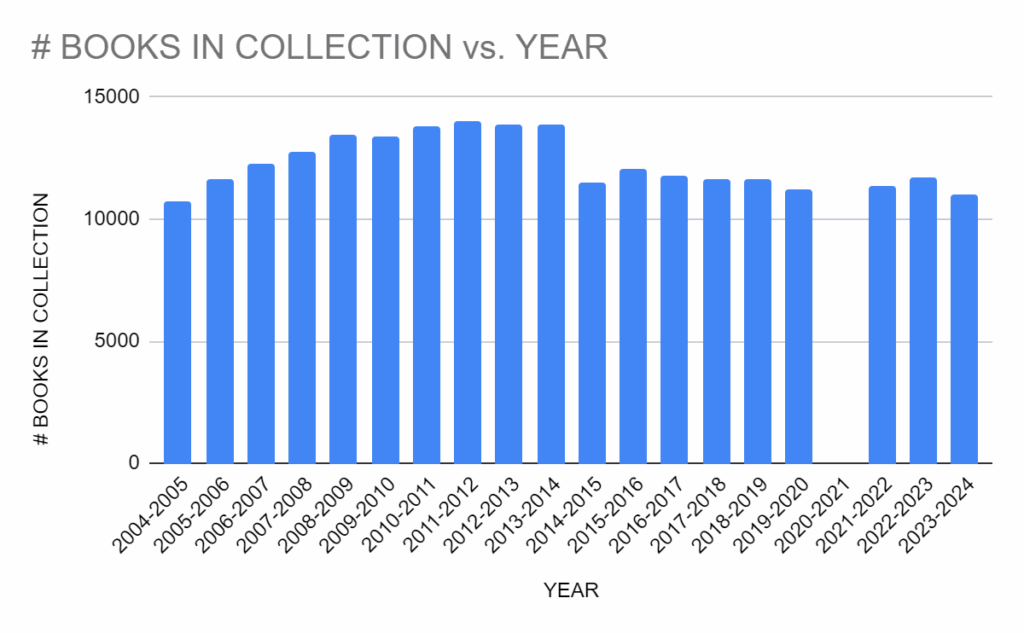
Collection
Having a large number of books is no longer the collection goal for school libraries. As Foundations for School Library Learning Commons in Canada: A Framework for Success states, “earlier standards for school libraries were based on output measures for things such as collection size, … [now] we have avoided setting arbitrary benchmarks. For example, having an excellent collection does not mean that learning is taking place” (Canadian School Libraries, 2023, p. 5,6). For many administrators, however, having these readily accessible numbers helps suggest that situations are positive in their schools. Collection statistics can help suggest areas for future purchasing focal points and demonstrate where the budget has been spent in tangible, concrete ways. Rattling off a number higher than 10,000 also seems to impress young children when they want to know how many books exist in this single, magical room!
Circulation
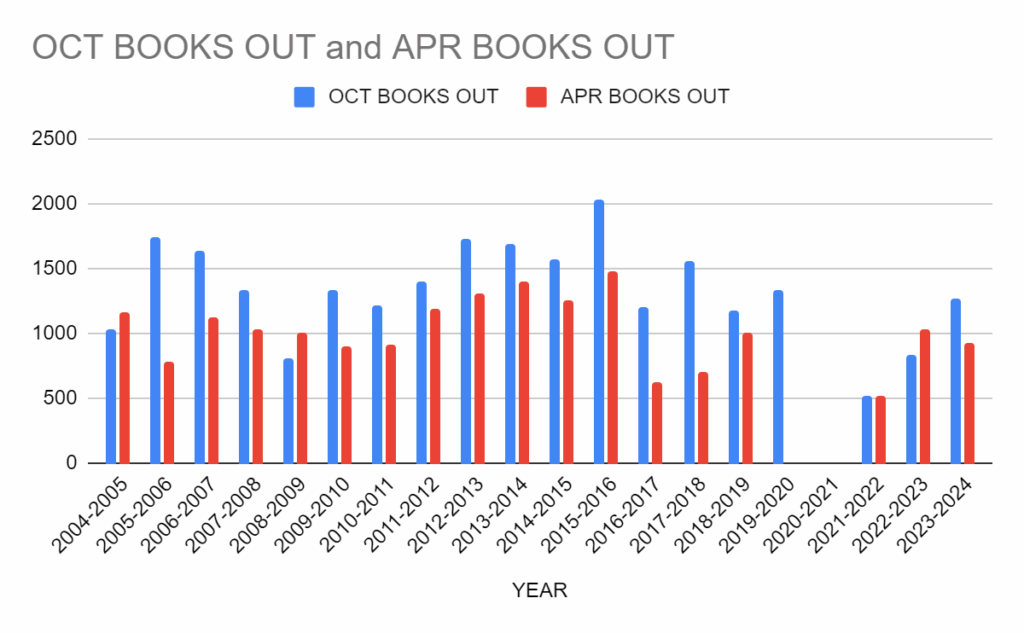
As Foundations for School Library Learning Commons in Canada: A Framework for Success states, “circulation is how we get resources into the hands of users” (Canadian School Libraries, 2023, p. 32). Circulation statistics can be misleading. Just because a student borrowed a book does not mean he/she/they have read it. Karen Jensen, in her post “Circulation Statistics are an Imperfect Measure of Who We Are and What Libraries Do” elaborates on this point:
“This data also doesn’t tell us if the patron liked the item, if they liked their experience of the library, or if that item made any impact on things like personal growth, education, or recreation. Circulation data is not the same as impact or use. To be clear, there is no real way we can measure this data, but it is a slippery slope to suggest that circulation is the same as impact. At the end of the day, the only thing this number tells us is that a patron checked out an item. It’s only the beginning of a story, of an item’s journey” (Jensen, 2018)
We need to tell our SLLC stories in multiple ways.
Annual Report Supplements: Scrapbooks, Infographics and Blog Posts
Scrapbooks
Output measures can be transformed into outcomes and impact measures with the inclusion of other references. A picture is worth a thousand words, and my scrapbooks are the qualitative counterpoint to my quantitative annual reports. Unfortunately, due to privacy concerns, these scrapbooks cannot be shared with wider audiences. They showcase actual students in action, capturing their reactions in the moment. They are also heavily curated to convey specific, pro-library messages. This paper is not meant to debate whether or not photos are media texts or deconstruct how images can be used as data – for a more thorough examination of this, consult “Texts and Images as Data in Qualitative Social Research: Proposing a Common Methodological Approach” (Radermacher, 2024). However, in tandem with annual reports, photo scrapbooks help elevate and communicate the impact of the school library learning commons on student mental health, well-being, and academic achievement.
Infographics
The infographics that I create are snapshots of the highlights from each of the annual reports. They are meant to be “digestible” and easily read. According to Christy Walters’ article, “The Benefits of Infographics for Education”, some of the advantages include:
- Targeting different learning styles
- Holding attention
- Improving retention and recall
- Simplifying complex topics
- Enhancing storytelling
- Applying visuals for a variety of uses (Walters, 2022).
The infographics I have created to work in conjunction with my annual learning reports can be found in Appendix C.
Blog Posts
My blog, Monday Molly Musings, has been in operation since 2009. It is one of the best ways I have to reflect on my professional practice in a transparent, accessible way. It fits well with Jordan Graham’s advice to share take-aways from conferences. I first posted my conference summary online retroactively – it was for the 2005 Ontario Library Association Super Conference (Maliszewski, 2011c). I had prepared these for my principal in the past, but never considered sharing them with a broader audience.
In my scrapbooks, I include links to blog posts that elaborate in depth on a photo or day’s events. The weekly blog posts are often promoted via social media (formerly through Twitter and now through Facebook and occasionally LinkedIn), where it is often seen and amplified by others. Comments and replies nourish conversations about the content in ways that a traditional annual report would find difficult.
Although my use of social media has declined since 2022 because “Twitter is a dumpster fire” (Maliszewski, 2022a), there are other ways that I try to communicate the results of my annual reports and scrapbooks. When Priscilla Yu was my school principal, she and I would meet together in the early summer to peruse the annual report and the scrapbook (Maliszewski 2011a). This practice ended when she left my school. I brought back a version of this tradition with my current principal and the admin team. I would schedule a catered lunch in the early fall and invite the chair people and principal to dine. The condition for the free lunch is that they are required to look at the scrapbook and read the annual report. I’ve also met with a pair of local school trustees in Tim Hortons outside of school hours, to sit with a coffee or tea and give them a copy of the annual report and a glimpse of the most current school year scrapbook. It was worth the time and money investment.
Conclusion
“When we talk about libraries, we need to gather as much data as possible to help us measure success and communicate this success to our administrators, our boards and our communities, but we need more than statistics. We need personal stories, we need patron feedback, and we need to paint a more holistic picture of who we are, what we are doing, and the benefit we bring to our communities. Statistics are not enough for us to tell our stories and measure our success” (Jensen, 2018).
I’m not 100% sure I know exactly what opportunities arose because of these annual reports. My budgets still went up and down, based on the school population. The trustee knows my face now, but how that translates to protected staffing in the library is uncertain. As someone familiar with research methods, I hesitate to draw any specific declarations of absolute causality. Even if I cannot pinpoint the direct correlations between these annual reports / infographics / scrapbooks / blog posts, the dissemination of these statistics and stories with concrete, beneficial results like elevated test scores or improved schedules with more collaborative teaching time, I can take comfort and pride in a few things.
- Collecting and creating these documents are valuable to me. They help me remember all the good things the students, educators, administrators and I accomplished together over the course of a school year. It’s easy to forget. Both my parents have dementia, and memories we thought would remain forever are now lost. I am so grateful that, when I realized that their recollections were disappearing, I took the time to record some of their old family stories in great detail. They can no longer tell these tales, but preserving them keeps them alive. Similar school library stories can be preserved, not just in the minds and hearts of the school library professionals, but with principals and vice-principals who can attest that they have a more-than-satisfactory school library learning commons. Veteran teachers can unintentionally evangelize to their newer colleagues when they reminisce about the time they co-taught with the teacher-librarian and talk about how much fun it was to collaborate. Students can testify to those lessons that seemed to be ordinary but were actually extraordinary and ones they’ll recall years in the future.
- We need to celebrate, and annual reports are acts of celebration. Rejoicing in what took place year after year honours the learning efforts of everyone in the building. Even when recording the times when the collaborations were few or non-existent, when the budget shrank, or when the space was ill-used, seeing that these bad times might hopefully be a momentary blip and turn around can provide hope. It is why I no longer am filled with despair when my timetable has less collaborative periods available. In 2008 I won the Follett International Canadian Teacher-Librarian of the Year, and in the very next year, I lost almost all of my partnering periods (Maliszewski, 2011b). Back then, I despaired. Now, I bide my time. Pendulums swing and schedules go through cycles. There’s always a chance that better timetables can be reinstated, budgets will be boosted, and colleagues will collaborate again.
- Sharing is caring. We must let others know what is going on in our school library learning commons – the good, the bad, and the beautiful. Little things matter. One of my greatest achievements in my school library was being one of the eight secretly profiled schools in the study Exemplary School Libraries in Ontario (Klinger et al, 2009). I can pinpoint a quote that came from my school (because they also referenced our school pets) that helps me see the impact when I don’t see it: “The librarian is the best thing about our school library. She is kind and helpful. Without her, there is no library” (Klinger et al, 2009).
Appendix A – 2004 Annual Report
Appendix B – Google Form Exit Ticket
References
Canadian School Libraries. (2023). Foundations for school library learning commons in Canada: A framework for success. https://www.canadianschoollibraries.ca/foundations-frameworks/
Canadian School Libraries. (2022). Treasure Mountain 7. https://tmc.canadianschoollibraries.ca/tmc7-2022/
Canadian School Libraries (CSL). (2020). Leading learning: Standards of practice for school library learning commons in Canada. https://llsop.canadianschoollibraries.ca/
Dreher, C. (2011, September 25). Why do books cost so much? Salon. https://www.salon.com/2002/12/03/prices/#:~:text=According%20to%20Bowker%2C%20the%20average,than%20they%20did%20in%201975.
Jensen, K. (2018, October 15). Circulation statistics are an imperfect measure of who we are and what libraries do. School Library Journal. https://teenlibrariantoolbox.com/2018/10/15/circulation-statistics-are-an-imperfect-measure-of-who-we-are-and-what-libraries-do/
Klinger, D., Lee, E., Stephenson, G, Deluca, C, Luu, K. (2009). Exemplary school libraries in Ontario. https://accessola.com/wp-content/uploads/2020/08/2006-Exemplary-School-Libraries-in-Ontario.pdf
Loertscher, D. V., Koechlin, C. & Zwaan, S. (2009). The big think. Hi Willow Research & Pub.
Maliszewski, D. (2024, September 23). How’s it going? STEM, ESL and partnering update. Monday Molly Musings. https://mondaymollymusings.blogspot.com/2024/09/hows-it-going-stem-esl-and-partnering.html
Maliszewski, D. (2022a, December 5). I miss microblogging. Monday Molly Musings. https://mondaymollymusings.blogspot.com/2022/12/i-miss-microblogging.html
Maliszewski, D. (2022b, March 14). March break misgivings and gaming hitches. Monday Molly Musings. https://mondaymollymusings.blogspot.com/2022/03/march-break-misgivings-and-gaming.html
Maliszewski, D. (2022c). Rebuilding after the COVID fire hit the forest of reading. Paper presented at the Treasure Mountain Canada 7 Symposium, New Westminster, Canada. https://researcharchive.canadianschoollibraries.ca/wp-content/uploads/2022/10/TMC7_2022_Maliszewski.pdf
Maliszewski, D. (2019, August 19). Redo the report (thanks to library inspiration). Monday Molly Musings. https://mondaymollymusings.blogspot.com/2019/08/redo-report-thanks-to-library.html
Maliszewski, D. (2012, July 30). The process: weeding, beta-reading, and writing. Monday Molly Musings. https://mondaymollymusings.blogspot.com/2012/07/the-process-weeding-beta-reading-writing.html
Maliszewski, D. (2011a, July 4). Changing of the guard. Monday Molly Musings. https://mondaymollymusings.blogspot.com/2011/07/changing-of-guard.html
Maliszewski, D. (2011b). Factors that support the development of exemplary school library programs. Paper presented at the International Association of School Librarianship Conference Proceedings, Kingston, Jamaica. https://journals.library.ualberta.ca/slw/index.php/iasl/article/view/7775
Maliszewski, D. (2011c, January 30). January extras – Super conference 2005 summary. Monday Molly Musings. https://mondaymollymusings.blogspot.com/2011/01/january-extras-super-conference-2005.html
Ontario Library Association. (2024). Forest of Reading. https://forestofreading.com
Ontario School Library Association. (2024.) OSLA administrator of the year award. https://accessola.com/wp-content/uploads/2021/06/OSLA-Admin-of-the-Year-Award-Policy-2021.pdf
Radermacher, M. (2024). Texts and Images as data in qualitative social research: Proposing a common methodological approach. International Journal of Qualitative Methods, 23. https://doi.org/10.1177/16094069241233170
People for Education. Assessment and measurement – People for Education. (n.d.). https://peopleforeducation.ca/wp-content/uploads/2017/12/PFE-Quick-PDF-AM.pdf
People for Education. (2013). From measuring what matters to the new basics. https://peopleforeducation.ca/measuring-what-matters/
Readers First. (2024). 2024 price update. https://www.readersfirst.org/2024-price-update#:~:text=The%20prices%20on%20consumer%20print,raised%20its%20prices%20the%20most.&text=Kindle%20prices%2C%20in%20line%20with,Schuster%20raising%20prices%20the%20most.
Schultz-Jones, B. & Oberg, D. (Eds.). (2015). IFLA school library guidelines 2nd revised edition. https://www.ifla.org/wp-content/uploads/2019/05/assets/school-libraries-resource-centers/publications/ifla-school-library-guidelines.pdf
Toronto District School Board. (n.d.). Agnes Macphail Public School (gr. JK-08). https://www.tdsb.on.ca/Find-your/Schools/schno/4669
Toronto District School Board. (n.d.). School budget allocations. Toronto District School Board. https://www.tdsb.on.ca/About-Us/Business-Services/Budgets-and-Financial-Statements/School-Budget-Allocations#:~:text=The%20library%20allocation%20is%20%2414.25,%2419.35%20per%20pupil%20for%20Secondary.
Walters, C. (2022, April 27). The Benefits of infographics for education. CopyPress. https://www.copypress.com/kb/infographics/the-benefits-of-infographics-for-education/
Diana Maliszewski, OCT BA BEd MEd is the teacher-librarian at Agnes Macphail Public School in the Toronto District School Board and has worked as a school library professional for over twenty-five years. From 2006 – 2018, she was the editor-in-chief of The Teaching Librarian, the official publication of the Ontario School Library Association. Currently, she is the co-Vice President of the Association for Media Literacy and Canada’s representative with the North American and European chapter of UNESCO’s Media and Information Literacy Alliance. Diana developed and still facilitates the Teacher Librarianship Additional Qualification courses for York University and Queen’s University. Diana has been honoured with several awards, such as the Follett International Teacher-Librarian of the Year in 2008 and the OLA President’s Award for Exceptional Achievement in 2013. She blogs weekly as part of her reflective professional practice at mondaymollymusings.blogspot.com.